Documentation Index
Fetch the complete documentation index at: https://astronomer-preview.mintlify.app/llms.txt
Use this file to discover all available pages before exploring further.
This is feature is only available if you are on theEnterprisetier or above. SeeAstro Plans and Pricing.
- Manually through the Astro UI.
- On a regular schedule.
- Whenever a certain condition is met, such as a metric reaching a specific threshold. This is known as a dashboard alert.
Prerequisites
- Only users with Organization Billing Admin user permissions can access Organization dashboards.
Download reporting data
- To view Organization Dashboards, in the Astro UI Organization section, click Dashboards. You can also access this page directly at https://cloud.astronomer.io/dashboards.
-
Click the Underlying Data tab. This tab contains the raw data that powers each dashboard chart in a standardized financial format, including the following tables:
- Deployment Activity: Deployment task, Dag, operator, and code push metrics aggregated by day, week, or month time periods.
- Workspace Activity: Workspace task, Dag, operator, and code push metrics aggregated by day, week, or month time periods.
- Daily Cost Breakdown: Costs broken down by day. Includes a second table in the FinOps FOCUS format.
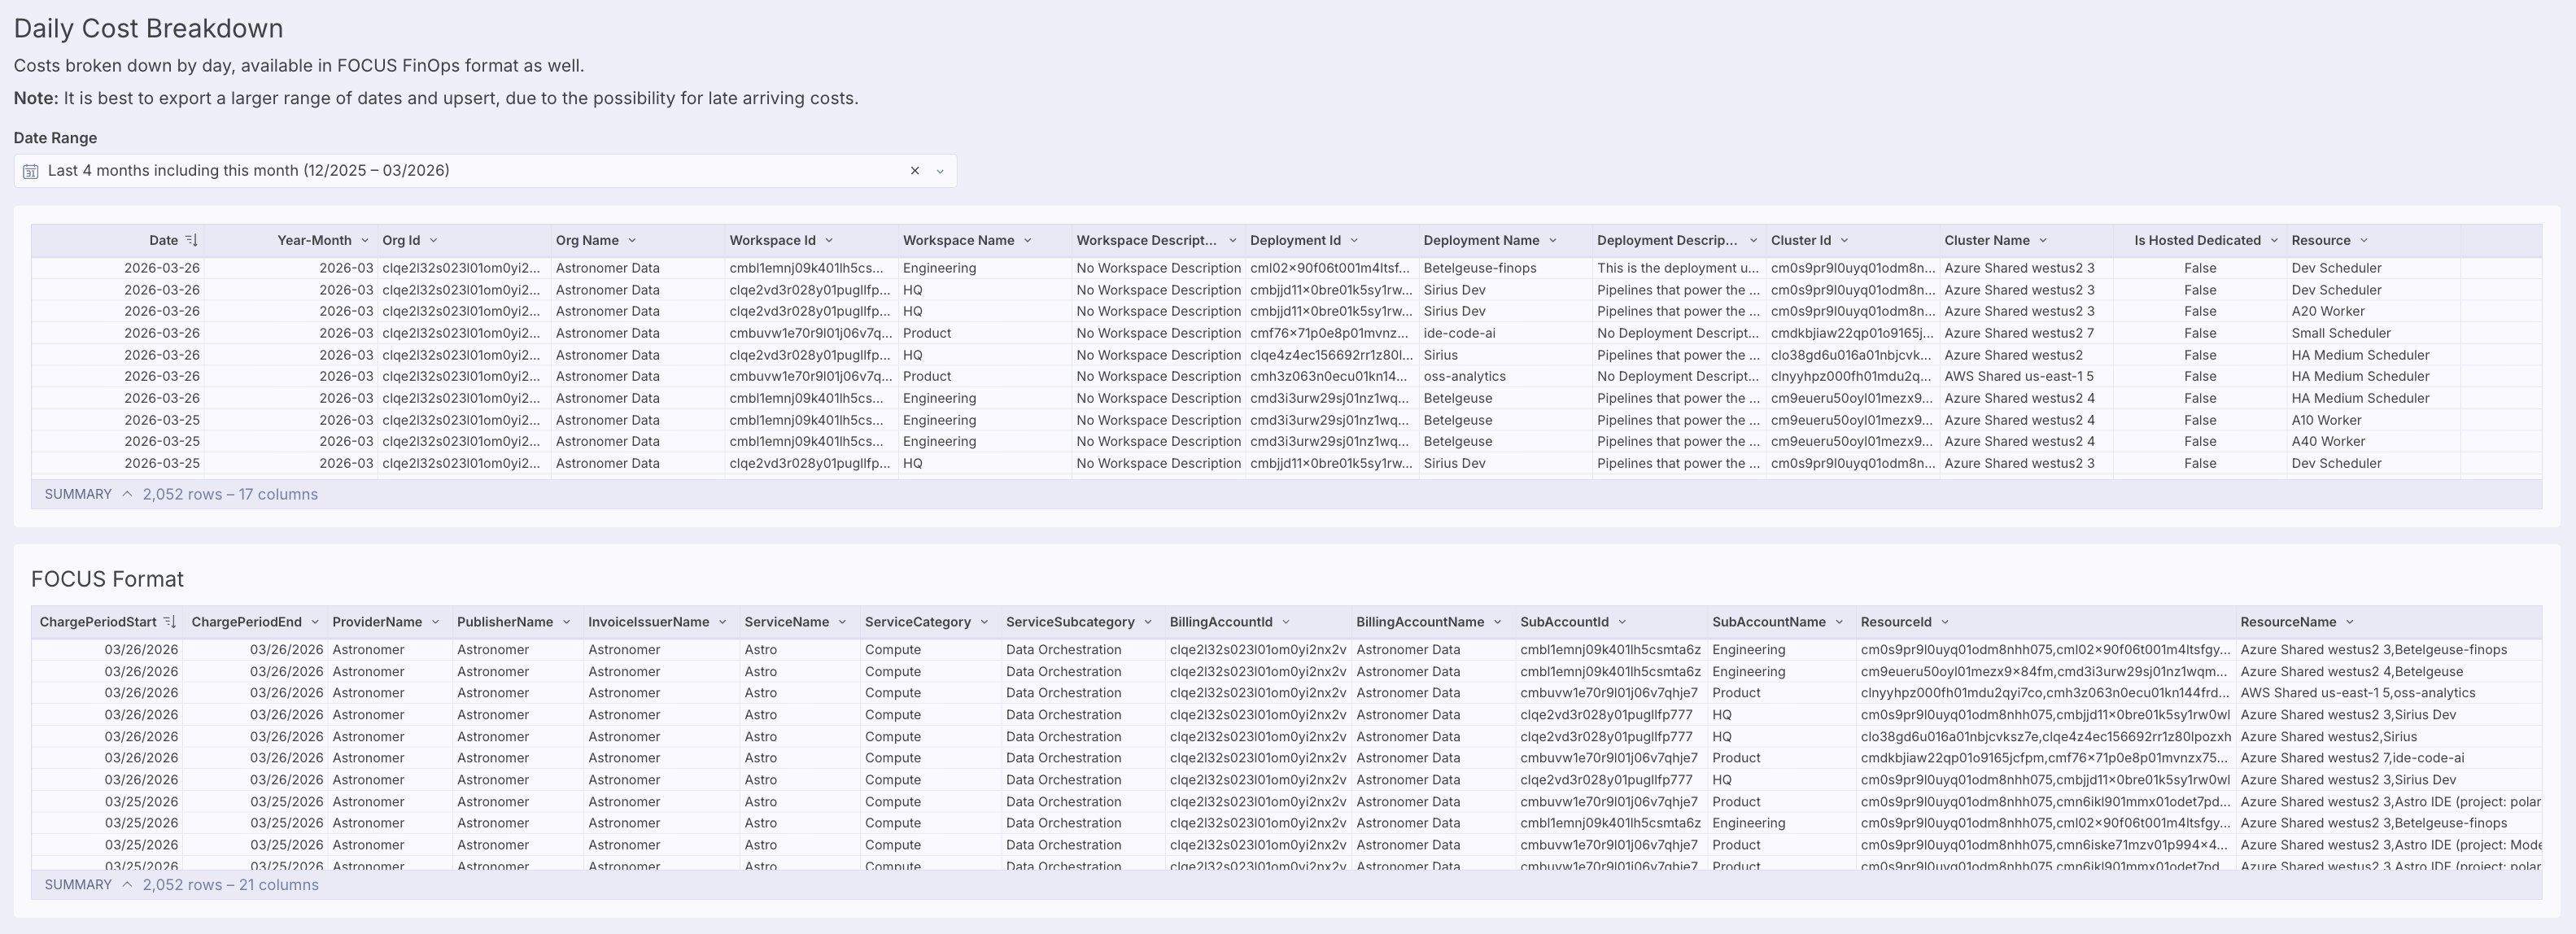 For theDaily Cost Breakdowntable, export a larger range of dates and upsert the data, because costs can arrive late.
 -
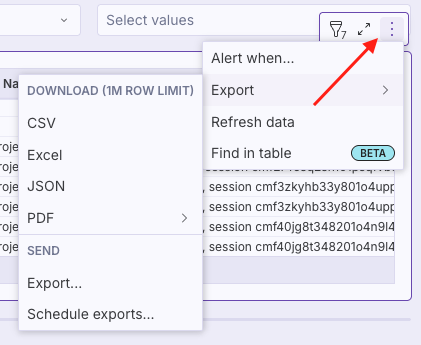
Click the three-dot menu on the table that you want to export, then click Export. Under DOWNLOAD, choose the file format that you want to download your data in. Astro generates your data export and saves it to your local computer.
Export reporting data
Instead of downloading your data directly, you can email it or send it to an external service through a webhook.- To view Organization Dashboards, in the Astro UI Organization section, click Dashboards. You can also access this page directly at https://cloud.astronomer.io/dashboards.
-
Click the Underlying Data tab, then click the three-dot menu for the table you want to export. Click Export, then under SEND, click Export….
-
Choose where you want to send the data report.
- Email - Enter the recipient’s email address and optionally edit the subject line and email body message.
- Webhook - (Sigma feature in beta) Add the webhook URL where you want to export your data to.
- In the Attachments section, select the report you want to send and file format to include it as. You can choose from the same file types that are available for a one-time data download.
- (Optional) To send more than one report, click + Add, and then select the report you want to send and its file format.

Schedule a data report
Astronomer recommends scheduling exports from the Underlying Data tab instead of from individual charts. The standardized format provides consistent data that replaces previous chart-specific export customizations.- To view Organization Dashboards, in the Astro UI Organization section, click Dashboards. You can also access this page directly at https://cloud.astronomer.io/dashboards.
-
Click the Underlying Data tab, then click the three-dot menu for the table you want to schedule an export for. Click Export, then under SEND, click Schedule exports….
-
Enter the where you want to send the data report.
- Email - Enter the recipient’s email address and optionally edit the subject line and email body message.
- Webhook - (Sigma feature in beta) Add the webhook URL where you want to export your data to.
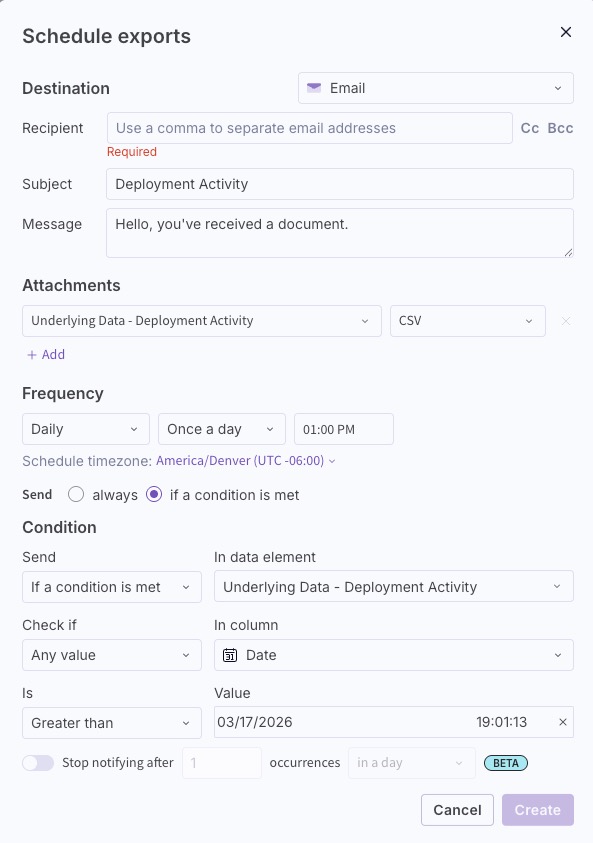
Create a dashboard alert
A dashboard alert contains a message and a data export that Astro sends when specific criteria are met in one of your reporting metrics. Use dashboard alerts to quickly receive messages and data when your metrics reach a specific threshold, such as when task failures exceed a certain amount.- To view Organization Dashboards, in the Astro UI Organization section, click Dashboards. You can also access this page directly at https://cloud.astronomer.io/dashboards.
-
Click the three-dot menu for the reporting element you want to set up an alert for. Click Alert when….
-
Configure the export destination and attachments, then in the Frequency section, select if a condition is met. In the Condition section that appears, define when you want the dashboard to send the data report.